
Modeling Colorado’s COVID-19 Epidemic
This article is part of an ongoing series on COVID-19, a collaboration of the Colorado School of Public Health, the Denver Museum of Nature & Science, and the Institute for Science & Policy. Tune in to our next webinar on Monday, May 18 at 8:30 a.m. MT discussing stories from front line medical caregivers. Find all of our previous COVID-19 webinars and recaps here.
There’s an old quote from the British statistician George Box that says: “All models are wrong, but some are useful.” In the age of COVID-19, when we’re being bombarded every day with new information about the epidemic, it can be difficult to know how to parse various sources and accurately convey the big picture. We may hear about five different models giving five different results, resulting in confusion for the public and policymakers alike, all of whom are looking for certain guidance.
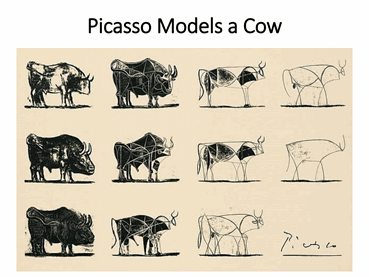 Each model is only a representation of reality. To illustrate this, I like to show this Picasso sketch of a cow. Notice how it transitions from the full complexity of a cow to its most basic elements. This is exactly what epidemiologists seek to do: take what happens during an epidemic of infection and reduce it to component parts, capturing how a susceptible population experiences an infection, becomes ill, and then recovers, albeit with some dying. Different models can be based on different underlying components, but they all seek to show something very straightforward: what has happened during an infection and what is likely to happen in the future, particularly as control measure are put in place.
About a month ago, my colleagues[1] and I put together a team to work with the Colorado Department of Public Health and Environment to address the state’s COVID-19 epidemic in order to help inform policy. One key initial goal was to anticipate how serious the epidemic would be and whether health care capacity could be exceeded, particularly for taking care of the most critically ill who might need a ventilator to support their damaged lungs. We also turned to control measures, exploring four specific components (social distancing, behavior by age, use of masks, and epidemiological control), overlaid onto a timeline from the date the state’s first case was reported (Feb. 20) through the implementation of social distancing (Mar. 17 and expanded Mar. 26) through today.
So what did we learn? Here are some key points based on our modeling:
- Social distancing measures appear to have worked. We estimate that these interventions have led to an approximately 75% to 78% reduction in the contact rate in Colorado based on reported case data through April 16th.
- The curve is indeed bending. The number of cases and the number of deaths have both showed signs of moderating. This is good news for now, because it means that we will not exceed our healthcare system’s capacity in the near term, but the degree and extent to which residents continue practice social distancing in the coming months will have a large impact.
- Much of Colorado’s population is still susceptible. We estimate that fewer than 2% of Coloradans have been infected to date. That leaves a large number of people ─ most of us ─ still at risk of catching the coronavirus, whether now or during a future peak.
- Masks are one way that we can do our part for others. Masks prevent us from expelling large droplets that could infect others. They also serve as a useful psychological reminder that we’re in pandemic setting and need to be vigilant. Wearing a mask is an easy “no regrets” strategy.
- The end game is to develop a vaccine or achieve herd immunity. We need to reach a threshold where the R0 number, or the number of new infections stemming from a single case, is smaller than 1, meaning the virus can’t propagate. We may get a vaccine eventually, but that could still be far off in the future. We’re in this for the long haul, absent a surprise such as unexpected seasonality of the infection.
It is essential to develop a plan for the next phase of the COVID-19 epidemic that controls case numbers to protect public health and assures that the healthcare system is not overwhelmed in the future. The key tools at our disposal include social distancing, protecting the vulnerable, case identification, contact tracing, and mask use. Our modeling suggests that social distancing by itself will not be enough; we’ll likely need to employ all of those strategies at once throughout the summer.
Lightning Round: Questions from Viewers
The coronavirus has been compared to SARS and MERS. Why were those diseases less widespread than COVID-19? SARS in particular had a high case-fatality rate and a very specific clinical picture, which made it easier to identify and isolate those who were ill. COVID-19 appears to have a much higher percentage of asymptomatic carriers, which facilitates undetected community spread. COVID-19 also manifests symptoms similar to influenza, creating difficulties in initial diagnosis.
How long does the virus live on a surface? It’s too soon to say for certain, and it likely depends on the material of the surface. Some experimental studies have suggested that COVID-19 can survive 24 hours on paper and cardboard.
Are those who’ve recovered from COVID-19 immune for any period of time? Can a recently infected person get sick again? This is a very important question, since we hope that a prior infection will provide long-term immunity. That question can’t be answered yet. In people who had SARS, antibody levels began to decline about three years after the infection.
Is there concern that Stay at Home being lifted for the state will lead to a rebound in infections? Yes, this is a key concern and the reason why we need to maintain substantial social distancing while also using the other tools that I described. We need to find the right balance point between starting back to normalcy while controlling the pace of the epidemic.
How is social distancing calculated within the context of your model? Until two months ago, “social distancing” was not a common phrase and not enough research had been done on how to track it. In our models, we consider the extent of contact among people and reduce that contact to see how well our strategies will work for slowing the epidemic. We can also use the model to see what degree of social distancing has been achieved. I showed that the steps taken in March had reduced contact by 75-80 percent. As we relax restrictions, we will track how mobility has increased using cell phone and other data.
Additional Resources:
Colorado Department of Public Health and Environment
Colorado School of Public Health Coronavirus Updates
Centers for Disease Control


Former dean of the Colorado School of Public Health and Professor of Epidemiology and Occupational and Environmental Health
Disclosure statement:
The Institute for Science & Policy is committed to publishing diverse perspectives in order to advance civil discourse and productive dialogue. Views expressed by contributors do not necessarily reflect those of the Institute, the Denver Museum of Nature & Science, or its affiliates.